610C-466 INSIGHT G4 SINGLE 3.125 ENSTROM
Part #: 610C-466610C466
Call for price
compareOverview
Insight Graphic Twin Engine Monitor G4
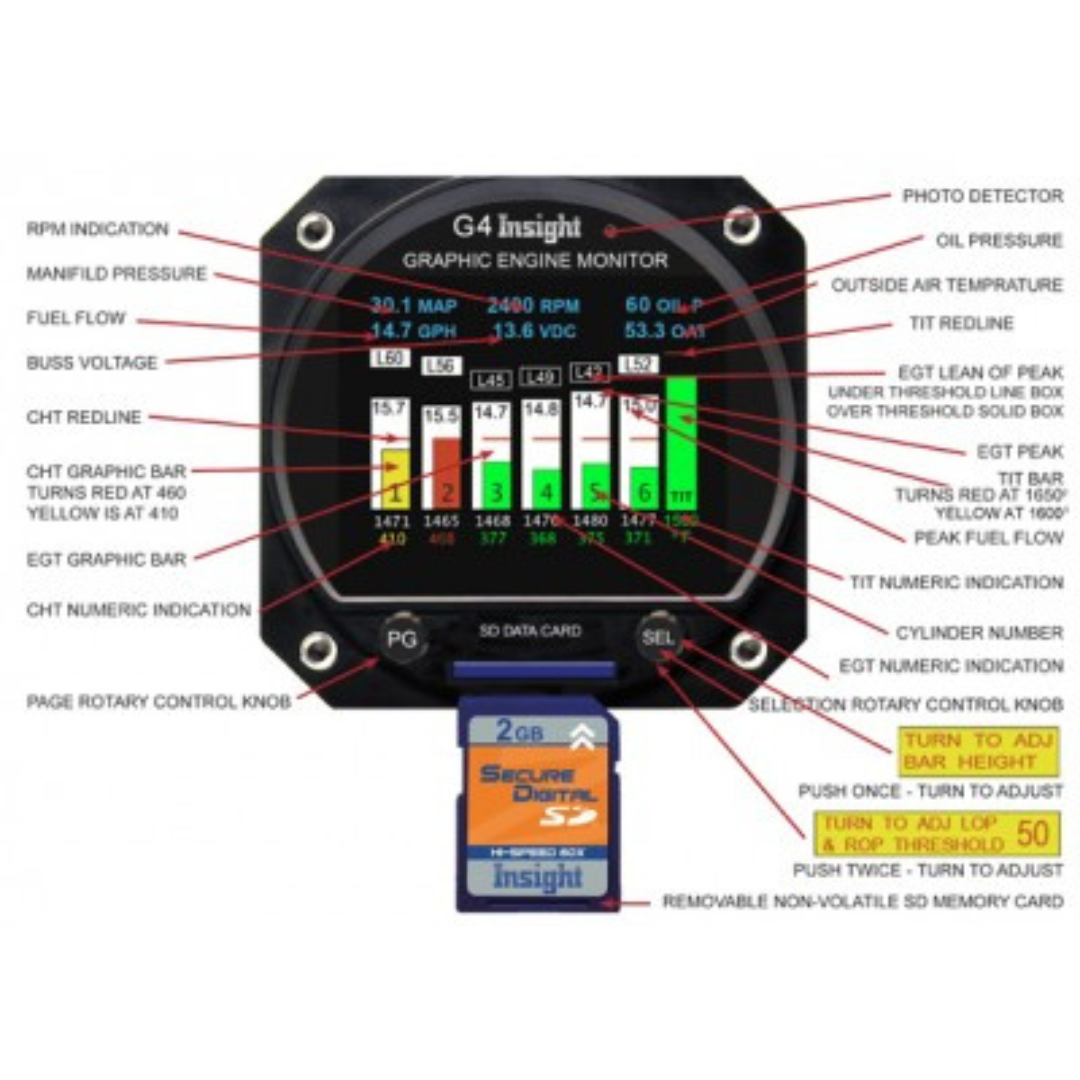
The original GEM was a solitary player. The new G4 will operate standalone too but will also interface with other data sources and report information to other instruments like MFD’s. All of the devices the G4 connects to today didn’t exist in ’79. The G4 is also designed to expand and grow with the times. Less than half of its true potential has been released at this time. The instrument can be updated to acquire new features by loading the SD card via the internet. The G4 update takes only a second while the instrument remains mounted in the airplane. Special Lean Of Peak Functionality / Unparalleled ease of operation / Nozzle balance analysis every time. Insight’s 610C Graphic Engine Monitor (G4) colour-coded bargraph and digital values may be Primary for CHT , EGT and TIT. All other data shown in cyan at the top of display are to be supplementary. Traditional multi-cylinder exhaust gas and cylinder head temperature systems that force the pilot to switch or scan an indicator from cylinder to cylinder in search of critical engine data, are long obsolete. Using the latest computer technology, the G4 presents a clear, concise, graphic picture of all engine temperatures simultaneously for interpretation at a glance. Never before has so much engine diagnostic information been available to the pilot and never before, has the pilot been able to control mixture with such ease and precision for peak fuel efficiency. Insight’s latest G4 automatically records flight temperature and will also interface with other data sources and report information to other instruments like MFD’s. The data-log files stored on the SD card can be easily retrieved by the pilot, in-flight or post-flight, for instant viewing or permanent record-keeping. The G4 is a sophisticated tool for engine management. Its microprocessor performs many tasks that used to be handled by the pilot. One of the basic functions performed by the G4 is monitoring exhaust gas temperatures for all cylinders with one degree resolution. What is important is the exhaust gas temperature of a particular cylinder in relation to its peak. But peak EGT is not a constant; it changes with atmospheric conditions, altitude, power setting and engine condition and for this reason absolute exhaust gas temperatures in degrees Fahrenheit are quite meaningless. The real objective of mixture management is finding a mixture setting which represents the correct position on the EGT/Fuel Flow Curve. As we will see later, this abstract task is easily accomplished by the G3’s microprocessor which samples EGT’s for all cylinders many times a second and subjects this data to a complex mathematical analysis can identify peak. This capability allows the pilot to operate his or her aircraft engine at the most economical mixture settings. It is generally known that EGT can be a valuable source of information for engine diagnosis and troubleshooting, but there is a great deal of confusion when it comes to interpreting this data. One of the basic principles of EGT engine analysis is that engine temperatures (EGT and CHT) achieve equilibrium in an engine operating at a constant power and mixture setting. What is often overlooked is that this equilibrium cannot be defined as a single point but rather a range of temperatures. The Graphic Engine Monitor is ready to operate the moment electrical power is applied. Within seconds after starting the engine, the white EGT bar graph columns will begin to appear on the G4 display. Each column corresponds to the Exhaust Gas Temperature (EGT) of a cylinder. The lowest exhaust gas temperature that can be displayed by the G4 is 800° F. In some engines, the throttle will have to be opened to the fast idle range to get an EGT indication for all cylinders. As the cylinder heads begin to warm up, the display will indicate Cylinder Head Temperature (CHT) for all cylinders as a smaller green bar in each EGT column. A horizontal red line across each column represents the maximum allowable CHT. Digital numbers below each bar graph column indicates the exact EGT and CHT for each cylinder. G4 Buss Voltage Controlling the G4 instrument The Bar-Graph Display Screen |
| Brands |
|---|
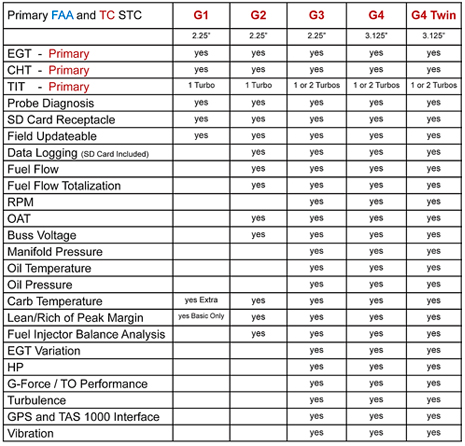
Reference Chart
Benefits
- Probe diagnostic screen
- Nozzle balance analysis, the key to lean of peak
- Real-time – Spectral Vibration Analysis
- Comprehensive data log – windows files SD card
- Over the web software updates – constant improvement
- Integral fuel computer with GPS fuel interface
- GEM plug compatible – easy install
- Exhaust valve analysis – EGT Variation Spectrum
Required Order Form
Features
Extensive Measurement Coverage
Simultaneous EGT, CHT, TIT
Bus voltage, instrument vacuum
Fuel flow, fuel used, alternator temp, OAT
Manifold pressure, RPM, oil temp, oil pressure
Continuous Probe Diagnosis
Confirm system integrity
Save time trouble-shooting
Sophisticated Data LoggingUnlimited storage on standard SD camera card
Integrates data from multiple sources
PC compatible files and directories
Detailed Vibration AnalysisSafely operate lean of peak
Detect early stage mechanical problems
Prevent catastrophic engine failures
Fully Compatible UpgradePlug & play with all GEM instruments
New installs or upgrades are quick and easy
GEM trade-in offers available


There are no reviews yet.